
概率门实验:Jev 的概率能直接用吗
Probability gate experiments: can Jev's probabilities be used as they are?
用真实的 Jev 做了三组实验:它给出的概率是否自洽,能不能当条件概率的来源,分步组合是否比直接问更准。结论是排序很准、数值偏向中间,少量真实数据就能校准;组合本身不提高精度,同向偏差会原样传下去。
Three experiments with the real Jev test whether its probabilities are self-consistent, whether it can serve as a source of conditional probabilities, and whether composing an answer in steps beats asking directly. It ranks well but pulls values toward the middle, and a small amount of real data is enough to calibrate it; composition by itself does not improve accuracy, and bias in a shared direction passes straight through.
上一篇《概率门:从比特到概率的电路》提出把 Jev 看作一种概率门,并列了几项要用真实 Jev 检验的设想。这篇记录第一批结果。
三组实验分别回答三个问题:
- Jev 给出的概率自不自洽?
- 它能不能当条件概率的来源?
- 把一个问题拆成几步再用代码组合,是否比直接问更准?
Jev 通过 Vercel AI Gateway 调用。三组实验共 161 次请求、约 10 万个输入 token,总费用约 0.004 美元。服务端单次耗时的中位数是 211 毫秒,95% 的请求在 334 毫秒以内,和官方给出的 70–500 毫秒一致。
实验一:概率是否自洽
数据是我们自己写的 40 条客服消息,涉及发货、退款、发票、故障等常见情况。每条消息问四个命题:A 客户在表达不满,B 客户要求退款,C 问题涉及物流配送,D 客户情绪激动。这一组不需要标注,只看 Jev 的回答之间是否符合概率规则。
正反双问基本一致。对 A、B、C,分别问「是」和「不是」,两个概率之和与 1 的平均差约 0.04,平均值接近 0,看不出「倾向回答是」的偏差。D 是例外,差了 0.14,原因在题目:「情绪激动」和「情绪平静」不是严格的反面,中间还有「略有不满」。差分门要求两个问题严格互补。
组合问题大多不自洽。对四组命题分别问 P(A)、P(B)、P(A 且 B)、P(A 或 B),160 组里有 81% 违反至少一条概率规则。最常见的是 P(A 或 B) 小于 P(A) 和 P(B) 中较大的那个,占 69%。直接问「A 或 B」平均得到 0.54;用 Jev 自己给的边际和合取推算,A + B − (A 且 B) 平均是 0.64。我又换了两种问法(「满足任意一项即可」和「1 − 两项都不成立」),结果仍然低 0.10–0.12。所以这是 Jev 对「或」的系统性低估,不是措辞问题。
同一次请求里的问题互不影响。一次请求问 16 个问题,和每次只问一个相比,结果平均差 0.006,最大差 0.03。
输出几乎是确定的。同一个问题再问一次,近一半答案完全相同,平均差 0.01。这意味着 Jev 的误差主要是系统误差,同一个问法重复问没有用。
这一组结果对设计的影响:
- 一致性恢复器是需要的,违反率很高;
- 「或」这类组合应该由代码根据边际和条件概率算出来,不要直接问;
- 冗余只能靠换问法、拆证据或换模型,不能靠重复调用;
- 一次请求可以放心地同时问多个问题。
实验二:能不能当条件概率的来源
上一篇认为,贝叶斯网络当年没有普及,主要卡在条件概率要靠专家手填;如果 Jev 能便宜地给出这些数字,这条路可能重新可行。检验这一点需要真实频率。
数据是 UCI Adult,一份公开的 1994 年美国人口普查摘录,共 32,561 人。我按性别、学历、年龄段分组,去掉不足 30 人的组,剩下 33 组、18,350 人。每组的真实值是组内年收入超过 5 万美元的人所占的比例,范围从 1.5% 到 87.5%。每组用三种问法问 Jev:直接问「随机抽一个人,年收入超过 5 万美元吗」,正反双问再合并,以及问比例并按 10 档打分。
| 问法 | 平均绝对误差 | 平均偏差 | 排序相关 | 校准后的平均绝对误差 |
|---|---|---|---|---|
| 直接问 | 0.148 | +0.131 | 0.966 | 0.064 |
| 正反双问合并 | 0.142 | +0.118 | 0.972 | 0.060 |
| 问比例,按 10 档打分 | 0.119 | +0.100 | 0.984 | 0.042 |
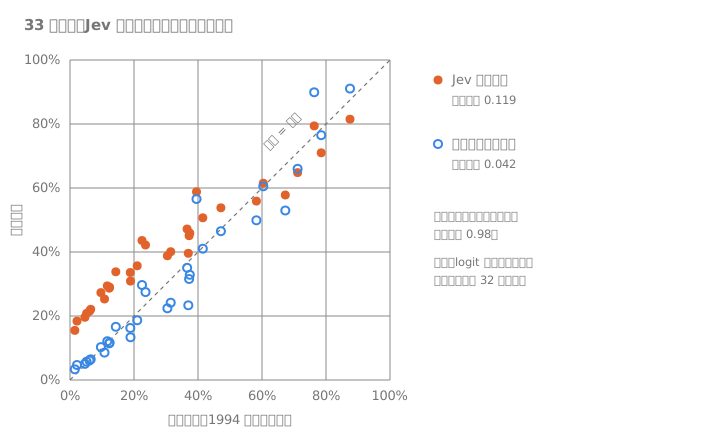
三点结论:
- 排序几乎完全正确。用 Spearman 相关衡量,三种问法都在 0.97 左右,哪一组比例高、哪一组低,Jev 判断得很准。
- 数值偏向中间。真实比例低于 20% 的组平均高估 0.16。例如 25–34 岁、读到 11 年级的女性,真实比例 1.5%,Jev 估计 15.5%。真实比例高于 50% 的组略微低估。
- 少量数据就能校准。在 logit 空间做一次线性校准,每一组都用其余 32 组的数据拟合,再预测这一组。按 10 档打分的问法,误差从 0.119 降到 0.042。
也就是说,Jev 给出了正确的排序和大致的形状,具体数值需要用少量真实数据校准。这支持上一篇里「条件概率的来源」和「校准器」两个判断,但「不用任何数据直接拿来用」不成立。
这一组有三个局限:只测了一个领域;Adult 数据集很有名,模型可能见过相关统计;「5 万美元」是 1994 年的金额,模型如果按今天的物价理解,可能是整体高估的原因之一。
实验三:分步组合是否比直接问更准
这一组检验「搭电路」本身。目标是 8 个群体(性别 × 25–64 岁的四个年龄段,共 25,655 人)中高收入的比例,用两条路线估计:
- 直接问:一个打分问题,问这个群体的比例;
- 分步组合:用一个多选题问学历构成,再用五个打分问题分别问各学历组的比例,最后由代码求和:Σ P(学历) × P(高收入 | 学历)。
为了看清误差来自哪一步,我还分别把两个门替换成真实值,并把实验二得到的校准用到两条路线上。
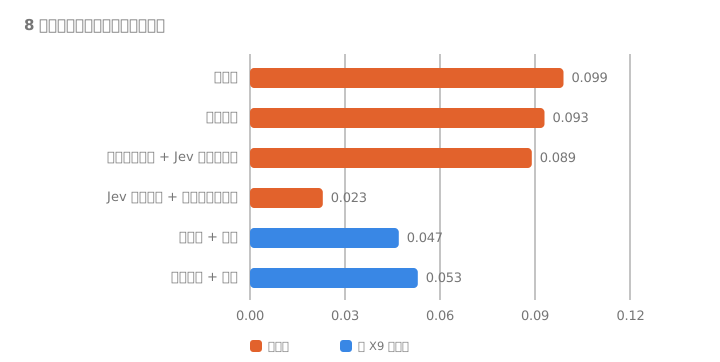
| 路线 | 平均绝对误差 | 平均偏差 |
|---|---|---|
| 直接问 | 0.099 | +0.099 |
| 分步组合 | 0.093 | +0.088 |
| 真实学历构成 + Jev 分学历比例 | 0.089 | +0.087 |
| Jev 学历构成 + 真实分学历比例 | 0.023 | −0.005 |
| 直接问 + 校准 | 0.047 | −0.047 |
| 分步组合 + 校准 | 0.053 | −0.053 |
- 分步组合没有比直接问更准,0.093 对 0.099。
- 误差几乎全部来自「分学历比例」这一步。它和实验二一样偏向中间,低收入学历组高估 0.12–0.13;五个学历组都往同一个方向偏,求和时抵消不掉。
- 「学历构成」这一步单独看误差不小:它高估了高中和本科,低估了「读过大学」和研究生,与真实分布的总变差距离是 0.29。但组合后几乎不影响结果,因为多估和少估的组收入比例相近,求和时相互抵消。
- 校准对两条路线都有效,误差降到约 0.05,但校正过头了,偏差变成负的。这次的校准是在「性别 × 学历 × 年龄」的细分组上拟合的,用到合并后的大群体上并不完全适用。
所以,拆成几步本身不会提高精度。误差在组合中是抵消还是保留,取决于方向:方向不一的误差会相互抵消,同向偏差会原样传下去。同向偏差只能靠校准处理,而且校准最好用同一层级的数据拟合。这和上一篇修订后的判断一致:概率电路更像模拟电路,要按误差预算来设计。这一组只有 8 个目标,结论只能看方向。
小结
成立的部分:
- Jev 的排序能力很强,三种问法在 33 组人口数据上的排序相关都在 0.97 左右;
- 少量真实数据就能把数值校准到可用的水平;
- 一次请求可以同时问十几个问题,彼此基本不影响;单次调用约 0.2 秒,成本很低。
需要修正的部分:
- 直接问组合命题(尤其是「或」)不可靠,应该由代码计算;
- Jev 的输出几乎是确定的,误差是系统误差,冗余要靠多样性;
- 分步组合不会自动提高精度,同向偏差需要校准,而校准要和使用的层级匹配。
下一步
- 误差随深度累积:让一串判断依次依赖上一步的结论,测每一级的误差和级与级之间的相关性;
- 前瞻预测:在 Jev 发布之后才揭晓结果的公开预测题上登记它的概率,对照预测市场和前沿大模型;
- 换领域:用中文、和业务更接近的数据重复实验二,检验校准能否跨领域使用。
说明:Jev 通过 Vercel AI Gateway 按量付费调用,客服消息由我们自己编写,人口普查数据来自 UCI 公开数据集。作者和榫卯 Tenon AI 与 TypeSafe AI 没有合作关系,也没有收到任何费用。
The previous post, "Probability gates: from bits to probabilities", proposed treating Jev as a probability gate and listed several ideas to test with the real Jev. This post records the first results.
The three experiments answer three questions:
- Are Jev's probabilities self-consistent?
- Can it serve as a source of conditional probabilities?
- Is splitting a question into steps and combining them in code more accurate than asking directly?
Jev was called through the Vercel AI Gateway. The three experiments used 161 requests and about 100,000 input tokens, for a total cost of about $0.004. The median server-side time per call was 211 ms, with 95% of requests under 334 ms, consistent with the 70–500 ms the company states.
Experiment 1: are the probabilities self-consistent?
The data is 40 customer-service messages we wrote ourselves, covering common cases such as shipping, refunds, invoices and faults. For each message we asked about four propositions: A, the customer is expressing dissatisfaction; B, the customer is asking for a refund; C, the issue involves shipping; D, the customer is upset. This experiment needs no labels; it only checks whether Jev's answers obey the rules of probability.
Asking both ways is mostly consistent. For A, B and C, asking "yes" and "no" separately gave probabilities whose sum differed from 1 by about 0.04 on average, with a mean close to 0, so there was no visible tendency to answer yes. D was the exception, at 0.14, because of how the question was written: "upset" and "calm" are not strict opposites; "a little annoyed" sits between them. A differential gate needs two questions that are strict complements.
Compound questions are mostly inconsistent. For four pairs of propositions we asked separately for P(A), P(B), P(A and B) and P(A or B). In 81% of the 160 pairs at least one rule of probability was violated. The most common violation was P(A or B) being lower than the larger of P(A) and P(B), in 69% of pairs. Asking "A or B" directly gave 0.54 on average; computing A + B − (A and B) from Jev's own marginals and conjunctions gave 0.64. Two other wordings ("either one is enough" and "1 − neither holds") were still 0.10–0.12 too low. So Jev systematically underestimates "or"; it is not a wording problem.
Questions in the same request do not affect each other. Asking 16 questions in one request versus one question per request changed the results by 0.006 on average and 0.03 at most.
The output is almost deterministic. Asking the same question again gave an identical answer nearly half the time, with an average difference of 0.01. This means Jev's errors are mainly systematic; repeating the same question does not help.
What this means for design:
- A coherence restorer is needed; the violation rate is high.
- Compounds such as "or" should be computed in code from marginals and conditional probabilities, not asked directly.
- Redundancy has to come from different wordings, split evidence or different models, not repeated calls.
- One request can safely ask many questions at once.
Experiment 2: can it serve as a source of conditional probabilities?
The previous post argued that Bayesian networks never caught on mainly because their conditional probabilities had to be filled in by experts, and that if Jev can supply those numbers cheaply, the approach may become workable again. Testing this needs real frequencies.
The data is UCI Adult, a public extract of the 1994 US census with 32,561 people. I grouped them by sex, education and age band and dropped groups with fewer than 30 people, leaving 33 groups and 18,350 people. The true value for each group is the share earning more than $50,000 a year, ranging from 1.5% to 87.5%. For each group Jev was asked three ways: directly ("pick one person at random; do they earn more than $50,000 a year?"), both ways and combined, and as a share on a 10-level scale.
| Wording | Mean absolute error | Mean bias | Rank correlation | Mean absolute error after calibration |
|---|---|---|---|---|
| Ask directly | 0.148 | +0.131 | 0.966 | 0.064 |
| Ask both ways, combined | 0.142 | +0.118 | 0.972 | 0.060 |
| Ask for the share on a 10-level scale | 0.119 | +0.100 | 0.984 | 0.042 |
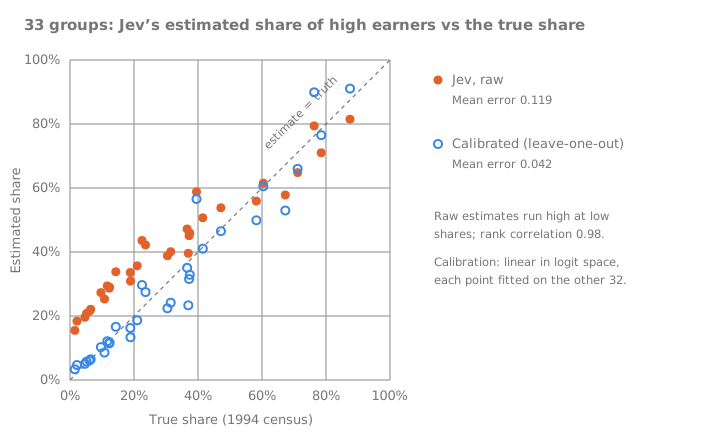
Three conclusions:
- The ranking is almost entirely right. Measured by Spearman correlation, all three wordings are around 0.97: Jev judges well which groups have higher shares and which have lower.
- The values are pulled toward the middle. Groups with a true share below 20% were overestimated by 0.16 on average. For example, women aged 25–34 who stopped at 11th grade have a true share of 1.5%; Jev estimated 15.5%. Groups above 50% were slightly underestimated.
- A little data is enough to calibrate. A linear calibration in logit space, fitted for each group on the other 32 groups and then used to predict that group, cut the error of the 10-level wording from 0.119 to 0.042.
In other words, Jev gives the right ranking and the rough shape, and the actual values need calibrating with a small amount of real data. This supports two ideas from the previous post, the source of conditional probabilities and the calibrator, but using the numbers as they are, with no data at all, does not hold up.
This experiment has three limits: it covers only one domain; the Adult dataset is well known, so the model may have seen related statistics; and $50,000 is a 1994 figure, so if the model reads it at today's prices, that may be part of why it overestimates.
Experiment 3: is composing in steps more accurate than asking directly?
This experiment tests building a circuit itself. The target is the share of high earners in 8 groups (sex × four age bands from 25 to 64, 25,655 people), estimated two ways:
- Ask directly: one scale question for the group's share.
- Compose in steps: a multiple-choice question for the education mix and five scale questions for the share in each education group, then a sum in code: Σ P(education) × P(high income | education).
To see which step the error comes from, I also replaced each of the two gates with the true values, and applied the calibration from experiment 2 to both routes.
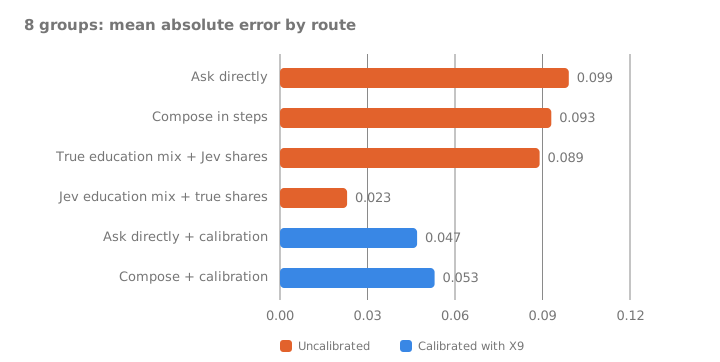
| Route | Mean absolute error | Mean bias |
|---|---|---|
| Ask directly | 0.099 | +0.099 |
| Compose in steps | 0.093 | +0.088 |
| True education mix + Jev shares by education | 0.089 | +0.087 |
| Jev education mix + true shares by education | 0.023 | −0.005 |
| Ask directly + calibration | 0.047 | −0.047 |
| Compose in steps + calibration | 0.053 | −0.053 |
- Composing in steps was not more accurate than asking directly: 0.093 against 0.099.
- Almost all the error comes from the shares-by-education step. As in experiment 2, it pulls values toward the middle, overestimating the low-income education groups by 0.12–0.13. All five education groups are off in the same direction, so the errors do not cancel in the sum.
- The education-mix step has a sizeable error on its own. It overestimated high school and bachelor's degrees and underestimated "some college" and graduate degrees, with a total variation distance of 0.29 from the true mix. But it barely affects the combined result, because the over- and underestimated groups have similar income shares, so the errors cancel in the sum.
- Calibration helps both routes, bringing the error down to about 0.05, but it overcorrects and the bias turns negative. This calibration was fitted on fine-grained cells (sex × education × age) and does not fully carry over to the larger merged groups.
So splitting into steps does not by itself improve accuracy. Whether errors cancel or survive in a composition depends on their direction: errors in different directions cancel, and bias in a shared direction passes straight through. Shared bias can only be handled by calibration, and the calibration is best fitted on data at the same level. This matches the revised view in the previous post: probabilistic circuits are closer to analog circuits and have to be designed to an error budget. With only 8 targets, the conclusion is directional.
Summary
What holds:
- Jev ranks very well; all three wordings reach a rank correlation of about 0.97 on the 33 census groups.
- A small amount of real data is enough to calibrate the values to a usable level.
- One request can ask a dozen or more questions with little interaction between them; a call takes about 0.2 seconds and costs very little.
What needs correcting:
- Asking compound propositions directly, especially "or", is unreliable; they should be computed in code.
- Jev's output is almost deterministic and its errors are systematic, so redundancy has to come from diversity.
- Composing in steps does not automatically improve accuracy; shared bias needs calibration, and the calibration has to match the level it is used at.
Next
- Error accumulation with depth: chain judgments so each depends on the previous conclusion, and measure the error at each stage and the correlation between stages.
- Forward forecasting: record Jev's probabilities on public forecasting questions that resolve after its release, and compare them with prediction markets and frontier language models.
- Other domains: repeat experiment 2 with Chinese data closer to business use, to test whether calibration carries over across domains.
Note: Jev was called and paid for per use through the Vercel AI Gateway. The customer-service messages were written by us, and the census data comes from the public UCI repository. The author and Tenon AI have no business relationship with TypeSafe AI and have received no payment.